Environmental Management
RATCH has deployed sustainable approaches when it comes to environmental management, to ensure the maximum efficiency and benefits of resource utilization and to prevent impacts and harms on the environment and natural resources. The environmental quality monitoring has been in place to control pollutants and waste from the production. On top of that, the Company aims to completely follow environmental rules and laws and exceed regulatory requirements.
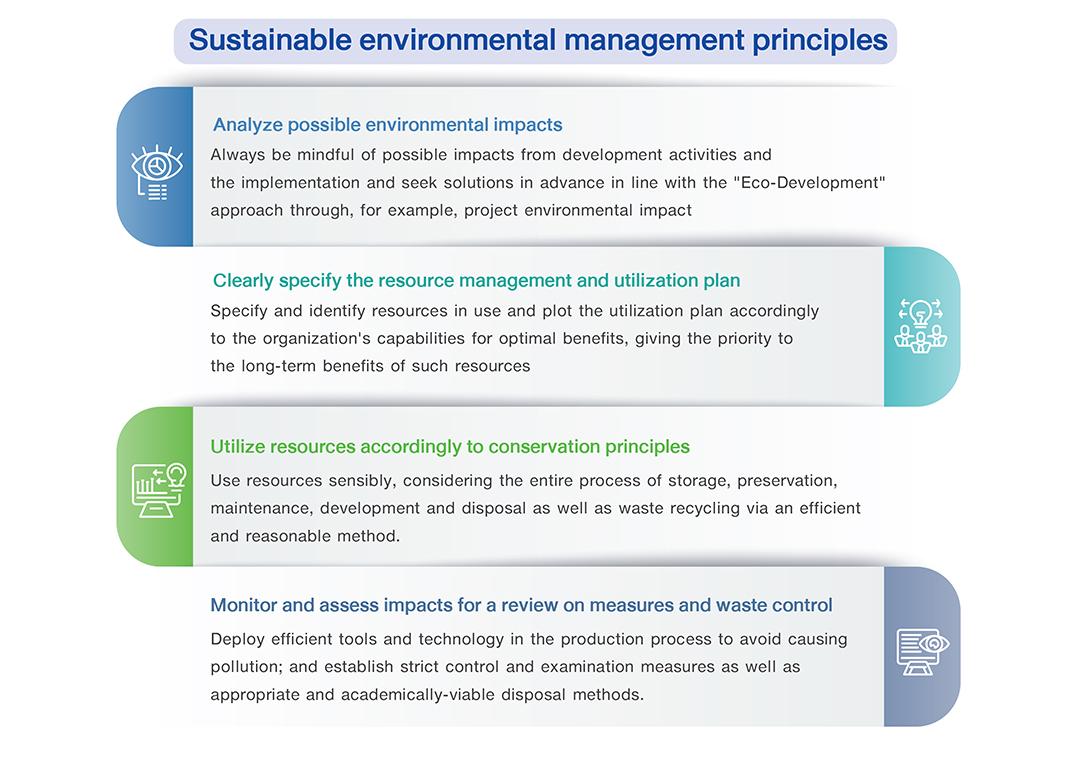
Realizing that electricity generation, our main business, is a resource-consuming process that may cause risks and impacts on the environment and nearby community, RATCH has established the environmental management system to minimize the likelihood of risks and impacts.
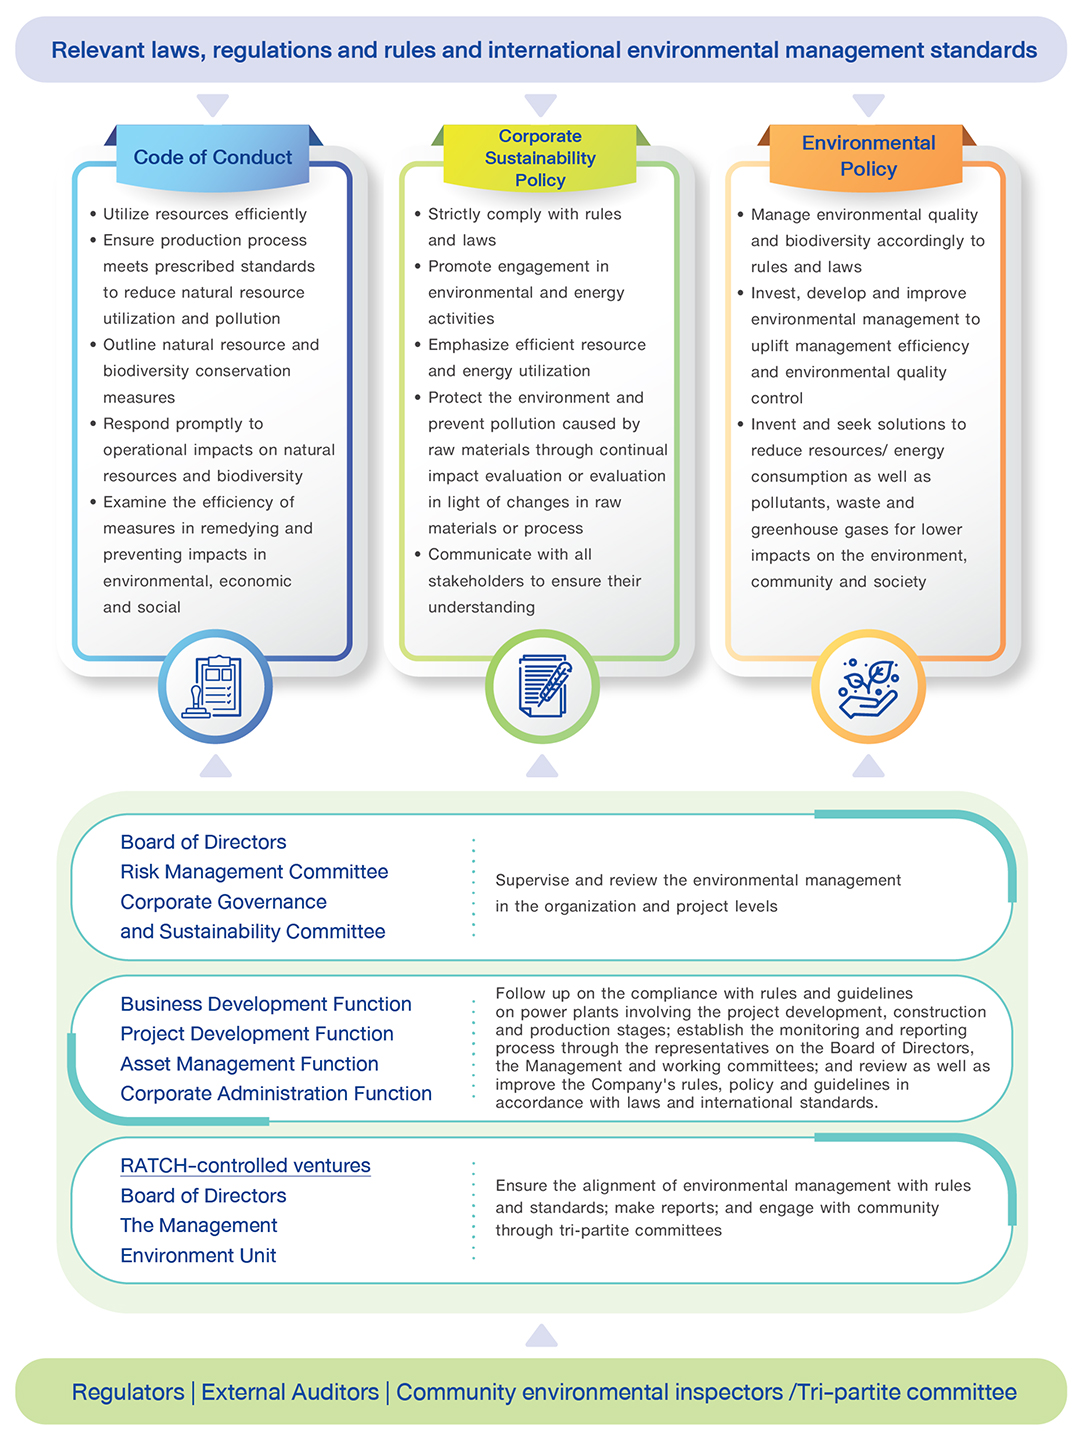
On environmental supervision, RATCH has shaped the Code of Conduct, the Environmental Policy and the Corporate Sustainability Policy based on environmental management laws, rules and regulations and international standards. All practices are shared with the businesses controlled by the Company, to streamline the operational approaches and organizational goals.
Structure of Environmental Supervision
Operational Eco-Efficiency
Direct & Indirect Greenhouse Gas Emissions
| Amount of emissions (tCO2e) based on carbon footprint for organization (CFO) assessment | ||||||||||||
|---|---|---|---|---|---|---|---|---|---|---|---|---|
| Power plant | Direct emissions (Scope 1)
|
Indirect emissions (Scope 2)
|
Other indirect emissions (Scope 3)
|
|||||||||
| Year | (base year) |
2020 | 2021 | 2022* | (base year) |
2020 | 2021 | 2022* | 2020 | 2021 | 2022* | |
| Ratchaburi | 7,128,375 (2015) |
4,997,704 | 4,950,948 | 6,302,398 | 27,702 (2015) |
18,837 | 28,131 | 22,270 | - | 2,413,616 | 2,729,674 | |
| RATCH Cogeneration | - | 313,927 | 300,854 | 307,544 | - | 25 | 1,069 | 149 | 91,804 | 88,628 | 89,527 | |
| Nava Nakorn | - | - | 515,185 | 485,947 | - | - | 50 | 31 | - | 159,912 | 153,777 | |
| Sahacogen (Chonburi) | - | - | - | 525,399 | - | - | - | 16 | - | - | 139,785 | |
| RATCH Group Building | 73 (2018) |
664 | 43 | 58 | 1,110 (2018) |
888 | 813 | 846 | - | 36 | 46 | |
Remark: *The information is under verification process.
Resource and energy consumption
All six RATCH-controlled power plants have 4,089 MW in combined installed capacity or 83.81% of total revenue in 2022. All use natural gas as the primary fuel source, except Ratchaburi Power Plant (with installed capacity of 3,645 MW or 72.25% of 2022 revenue) which was designed to work primarily on natural gas and also on diesel and bunker oil as the secondary fuel source. For national energy security, the power plant uses diesel or bunker oil when natural gas supply from Myanmar is stopped following maintenance and other necessities. The fuel switch follows EGAT National Control Center’s order. In 2022, the center ordered Ratchaburi Thermal Power Plant Unit 1 and 2 with 735 MW capacity each to use bunker oil.
| Indicator | Unit | 2022 | 2021 | 2020 |
|---|---|---|---|---|
| Volume of natural gas | million cubic feet | 149,202 | 121,482 | 129,310 |
| Volume of bunker oil | liter | 290,691,483 | 161,121,423 | 0 |
| Volume of diesel | liter | 21,881,178 | 9,244,423 | 2,020,571 |
| Net generation output | megawatt-hour | 18,488,776 | 14,625,418 | 14,933,403 |
| Consumption of renewable energy | megawatt-hour | 13,860 | 2,858 | 0 |
- In 2022 are reported the consumption and performance of Ratchaburi Power Plant, Berkprai Cogeneration Power Plant, Nava Nakhon Generating Power Plant, Ratch Cogeneration Power Plant, Nexif Ratch Energy Rayong Power Plant and Sahacogeneration Power Plant (Chonburi)
- In 2020 - 2021 are excluded Sahacogeneration Power Plant (Chonburi) and Nexif Ratch Energy Rayong Power Plant.
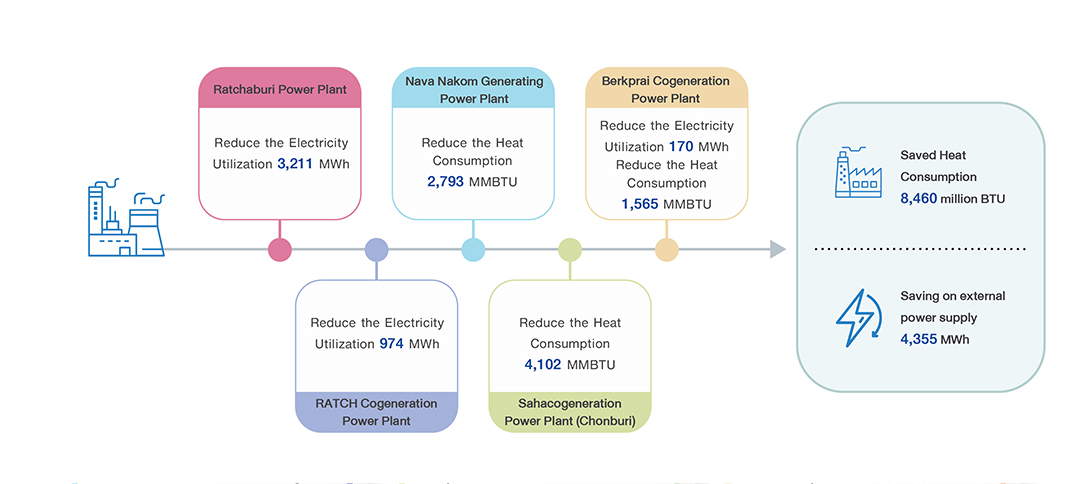
Production process improvement to reduce fuel and energy utilization
The generation efficiency of RATCH’s controlled power plants in 2022 averaged 47.65%, in line with the performance target.
Reflecting the emphasis on resource optimization, RATCH-controlled power plants have invented and modified machine operations as well as enhanced machinery and equipment efficiency, aiming to reduce fuel and energy utilization and raise economic benefits through a lower production cost. The attempt will also support the sustainable development goal on sustainable consumption.
Water management
RATCH emphasizes a systematic water management system and the planning of water utilization in the production process. The focus is placed on a cut in utilization, an increase in reuse, recycling and avoidance of waste creation in line with the 3Rs principles. The goal is to enhance water utilization efficiency, reduce loss, slash raw water demand and reduce the volume of water discharge.
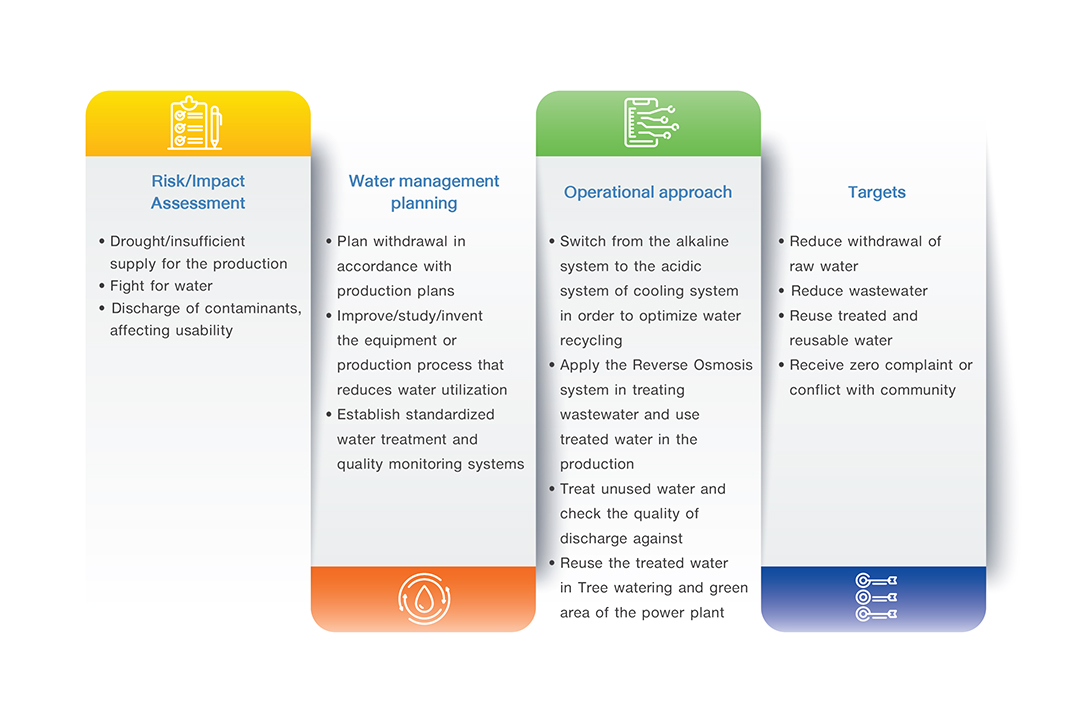
Water related risk
The controlled power plants in Thailand used raw water for electricity generation activities from three major sources: the Mae Klong River Basin, the Chao Phraya River Basin and the Bang Pakong River Basin. RATCH Group’s power plants give importance to monitor closely the water releases and raw water usage. The data is the basis for the assessment of risks relating to water shortage and conflicts with community over water as well as water stress accordingly to World Resources Institute (Aqueduct Water Risk Atlas and the Water Risk Filter). The analysis shows a low water stress level for the Mae Klong River Basin and a high stress level in the Chao Phraya River Basin and the Bang Pakong River Basin.
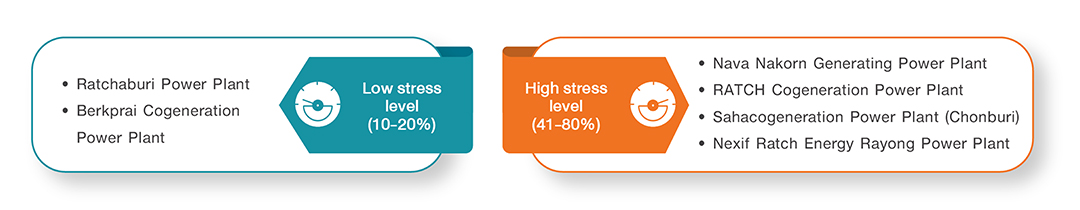
RATCH takes measures to tackle shortage risks, particularly for Nava Nakorn Power Plant and RATCH Cogeneration Power Plant that use tap water made from water in the Chao Phraya River Basin and Sahacogeneration Power Plant (Chonburi) and Nexif Ratch Energy Rayong Power Plant that use tap water made from water in the Bang Pakong River Basin. Through long-term contracts and supply-related risks management , the tap water producer and distributors are required to locate a secondary and emergency water source in case of drought or shortage in the main sources. That is to ensure a sufficient water supply to the power plants.
Water utilization in power generation in 2022
| Power plant | Water source | Raw water (million cubic meter) | Water utilization per power unit (cubic meter/ megawatt-hour) | Water discharge | Net water utilization (raw water – water discharge) (million cubic meter) | ||
|---|---|---|---|---|---|---|---|
| Volume (cubic meter/ megawatt-hour) | (%) of utilized raw water | Discharge channel | |||||
| Ratchaburi | Mae Klong | 16.67 | 1.13 | 1.60 | 9.59 | Klong Bang Pa | 15.07 |
| Berkprai Cogeneration | Mae Klong | 0.89 | 1.49 | 0.27 | 29.98 | Mae Klong River | 0.63 |
| Nava Nakorn | Tap water coming from Chao Phraya River | 1.78 | 1.55 | 0.12 | 6.71 | Central Waste Water Treatment | 1.66 |
| RATCH Cogeneration | Tap water coming from Chao Phraya River | 0.97 | 1.36 | 0.11 | 11.21 | Sent to other organizations for utilization | 0.86 |
| Nexif Ratch Energy Rayong | Tap water coming from Bang Pakong River | 0.40 | 1.33 | 0.07 | 17.62 | Klong Chang Tai | 0.33 |
| Sahacogeneration (Chonburi) | Tap water coming from Bang Pakong River | 1.79 | 1.78 | 0.54 | 29.94 | Sahapat Industrial Park | 1.26 |
Cycle of concentration in cooling water system
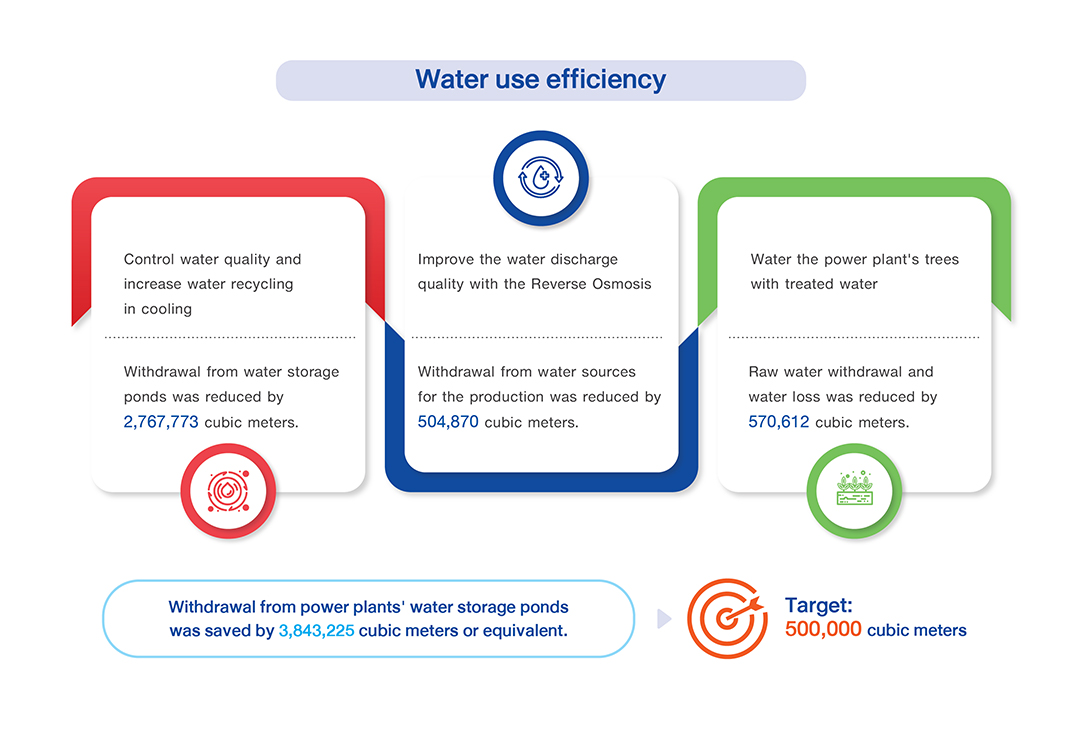
All six RATCH-controlled power plants in Thailand emphasize the efficiency and optimization of the water management system. They have continually studied and explored the means to reduce the production process’ water use and enhance the efficiency of water cycles in the water-intensive cooling system. The water cycles in the cooling system have been optimized as best as possible, to reduce raw water inflows and unnecessary water discharge. The performance in 2022 is as follows:
| Project | Province | Target water use (cycle) |
Average water cycles in 2022 |
|---|---|---|---|
| Ratchaburi Thermal Power Plant | Ratchaburi | 4-6 | 2.6 |
| Ratchaburi Combined Cycle Power Plant | 4-6 | 4.8 | |
| Berkprai Cogeneration Power Plant | 5 | 3.7 | |
| Nava Nakorn Generating Power Plant | Pathum Thani | 5 | 4.1 |
| RATCH Cogeneration Power Plant | 6 | 7.3 | |
| Nexif Ratch Energy Rayong Power Plant | Rayong | 6 | 6.7 |
| Sahacogeneration Power Plant (Chonburi) | Chonburi | 5-13 (Set 1) | 7.8 |
| 3-8 (Set 2-3) | 4.1 |
Waste Management
All power plants under RATCH’s control have put efforts in managing waste from production and non-production activities. The 3Rs principles have been applied to stress resource optimization, reuse, waste reduction, repair, recycling and rejection to waste generation. Importantly, all are geared towards zero waste to landfill.
The power plants in Thailand have also fully followed the Ministry of Industry’s announcement in B.E. 2548 on industrial waste disposal and tracked waste disposal by authorized waste processors through the application of the manifest system. Manifest sheets are prepared to control the disposal process, from waste transportation to waste processing facilities to the processor’s reporting to the Department of Industrial Works.
Waste volume and disposal
The power plants’ waste is generated by either the production process or activities in office buildings. Hazardous waste will be separated from non-hazardous waste, to ensure management efficiency and achieve the zero waste to landfill target.
Performance in 2022
The recovery rate of hazardous and non-hazardous waste was 97.29% while 1.12% of waste was disposed by methods other than landfill.
| Disposal methods | Applied method | Type of waste (Ton) | Total (Ton) | % | |
|---|---|---|---|---|---|
| Non- hazardous | Hazardous | ||||
| Transformation to new materials (Recovery) 97.29% | Reuse | 15.3 | 0 | 15.3 | 0.05 |
| Recycle | 6,435.7 | 20.6 | 6,456.3 | 21.07 | |
| Other Recovery | 23,335.2 | 11.9 | 23,347.1 | 76.17 | |
| Disposal 2.71% | Incineration with Energy Recovery | 0 | 186.7 | 186.7 | 0.61 |
| Incineration without Energy Recovery | 1.3 | 10.7 | 12 | 0.04 | |
| Landfilling/ Storage | 459.4 | 34.7 | 494.1 | 1.61 | |
| Other Disposal Operations | 0.9 | 137.0 | 137.9 | 0.45 | |
Ratchaburi Power Plant’s gypsum disposal
Ratchaburi Thermal Power Plant was instructed by EGAT to operate with more bunker oil. It was thus required to switch on the desulfurizer that produced 5,057.5 tons of waste gypsum. The gypsum was recoverable and accounted for 16.5% of all recoverable waste. The gypsum was stored in the gypsum pond, waiting for the recovery process.
Ratchaburi Power Plant gradually uses the stored gypsum in gypsum board manufacturing for community use. In 2022, 5,057.5 tons of gypsum was used. Since 2016, 45,758.5 tons of gypsum has been used. The gypsum board manufacturing is a collaboration between Ratchaburi Power Plant and Siam Gypsum Industry (Songkhla) Company Limited and Knauf Gypsum (Thailand) Company Limited. The gypsum boards are handed to community.
Air quality management
Thermal and combined cycle power plants need a system to emit contaminated combustion air to the atmosphere. It is thus necessary to tackle significant pollutants – sulfur dioxide and nitrogen oxide – and strictly keep them within legal emission permissible limits.
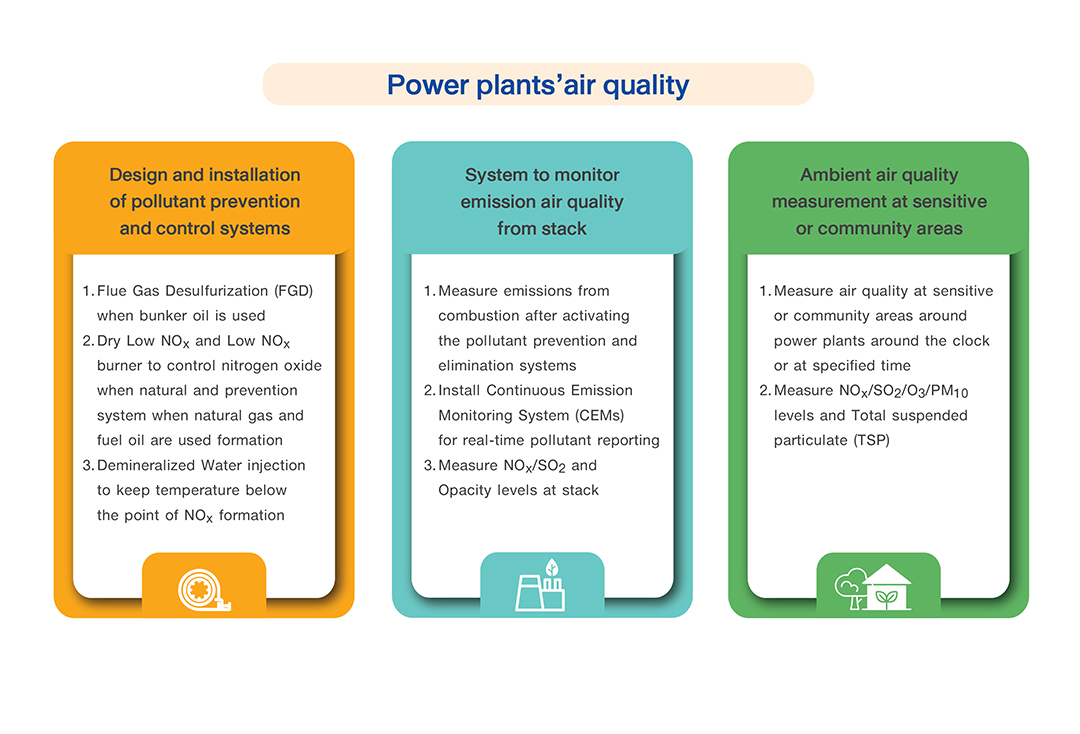
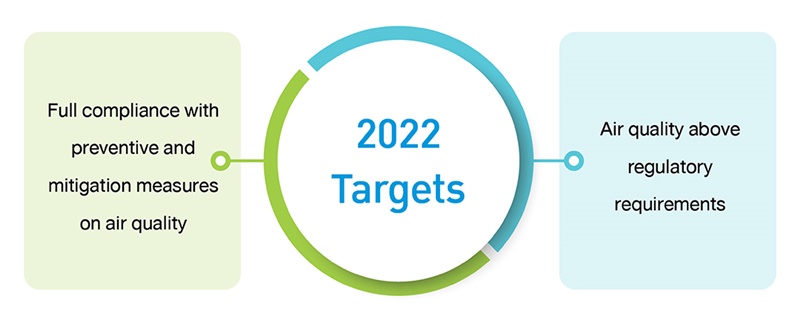
Power plant air quality measurement
In 2022, RATCH controls 6 power plants which contribute 83.81% of total revenue. The power plants have continually measured the pollutant intensity at stacks. At Ratchaburi Thermal Power Plant where Unit 1 and Unit 2 were ordered by the Electricity Generating Authority of Thailand to operate with bunker oil in light of natural gas price hikes, the intensity remained within permissible limits. Notably, the Continuous Emission Monitoring System is verified for accuracy and precision by an external verifier.
| Power plant | Average pollutant concentration | ||||
|---|---|---|---|---|---|
| NOX (ppm) | SO2 (ppm) | Secondary energy source | |||
| Natural gas | Fuel oil | Natural gas | Fuel oil | ||
| Ratchaburi Thermal Power Plant | 25.95 | 102.28 | 0.43 | 192.43 | bunker oil |
| Ratchaburi Combined Cycle Power Plant | 31.63 | 114.40 | 2.54 | 30.62 | diesel |
| Target (Not exceeding legal limits)* | 120 | 180 | 20 | 320 | - |
| Berkprai Cogeneration Power Plant | 26.15 | - | 0.25 | - | None |
| Nava Nakorn Generating Power Plant | 30.6 | - | 4.80 | - | None |
| RATCH Cogeneration Power Plant | 44.5 | - | <1 | - | None |
| Nexif Ratch Energy Rayong Power Plant | 44.7 | - | <2 | - | None |
| Target (Not exceeding EIA-specified limits)* | 60 | - | 10 | - | - |
| Sahacogeneration Power Plant (Chonburi) Unit HRSG#1 | 73.09 | - | 0.34 | - | None |
| Sahacogeneration Power Plant (Chonburi) Unit HRSG#2 | 75.13 | - | 0.29 | - | None |
| Target (Not exceeding EIA-specified limits) | 110 | - | 18 | - | - |
| Sahacogeneration Power Plant (Chonburi) Unit HRSG#4 | 90.71 | - | 0.67 | - | None |
| Target (Not exceeding EIA-specified limits) | 108 | - | 18 | - | - |
| Sahacogeneration Power Plant (Chonburi) Unit HRSG#5 | 22.83 | - | 0.54 | - | None |
| Target (Not exceeding EIA-specified limits) | 90 | - | 15 | - | - |
- Average pollutant concentration as reported by Continuous Emission Monitoring Systems
* Permissible limits as in the B.E. 2547 notification of Ministry of Industry on the limit of air pollutants emitted by power-generating, transmission or distribution plants
Ambient air quality monitoring
The power plants have also monitored and watched out for the ambient air quality in nearby areas, specified in EIA as the areas that may be affected by the operations. The monitoring in 2022 showed the ambient air quality at all power plants and nearby community stayed within permissible limits. The atmospheric ozone level at Ratchaburi Power Plant’s upwind and downwind directions was found higher than the limit in the dry season, which happened every year.
| Power Plant | 24-hour Average | 1-hour Average | ||||
|---|---|---|---|---|---|---|
| Total Suspended Particulate (μg/m3) | Particulate Matter smaller than 10 micron (μg/m3) | SO2 (ppb) | SO2 (ppb) | NO2 (ppb) | O3 (ppb) | |
| Ratchaburi Thermal Power Plant | 4-151 | 3-119 | 0-7 | 0-53 | 0-56 | 0-156* |
| Berkprai Cogeneration Power Plant | 13-91 | 5-39 | 0.9-4.7 | 0.1-6.7 | 0.1-44.7 | No Monitor |
| Nava Nakorn Generating Power Plant | 26-108 | 12-60 | 1-6.2 | 1-9 | < 1-12.8 | No Monitor |
| RATCH Cogeneration Power Plant | 29-190 | 7-57 | 1.5-3.8 | 0.9-5.2 | 2-22.7 | 8.8-35.5 |
| Nexif Ratch Energy Rayong Power Plant | 17-73 | 11-54 | No Monitor | < 1-5 | < 1-36 | No Monitor |
| Sahacogeneration (Chonburi) | 18-178 | No Monitor | No Monitor | 1-39 | 1-40 | No Monitor |
| Target (Not exceeding legal limits) | 330[1] | 120[1] | 120[1] | 300[2] | 170[3] | 100[4] |
- Standards in line with the Notification of National Environment Board
- [1] as specified in the No.24 Notification of the National Environmental Board (B.E.2547) on ambient air quality standards
- [2] as specified in the No.31 Notification of the National Environmental Board (B.E.2544) on 1-hour sulfur dioxide standard in ambient air
- [3] as specified in the No.33 Notification of the National Environmental Board (B.E.2552) on nitrogen dioxide standard in ambient air
- [4] as specified in the No.28 Notification of the National Environmental Board (B.E.2550) on ambient air quality standards
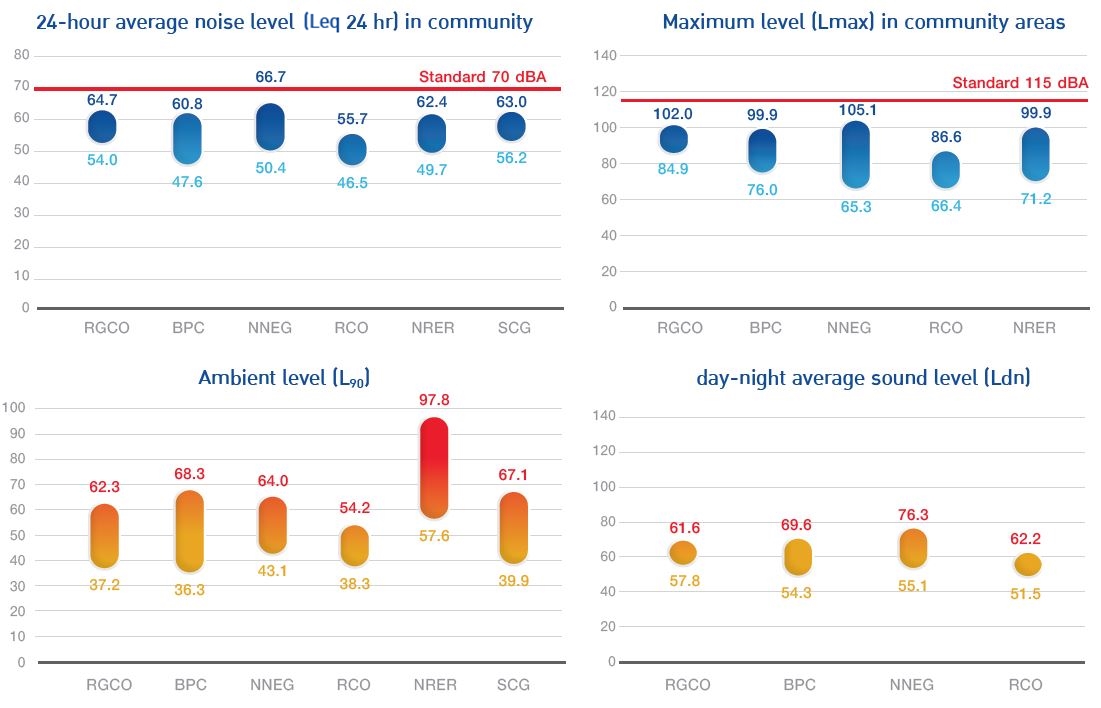
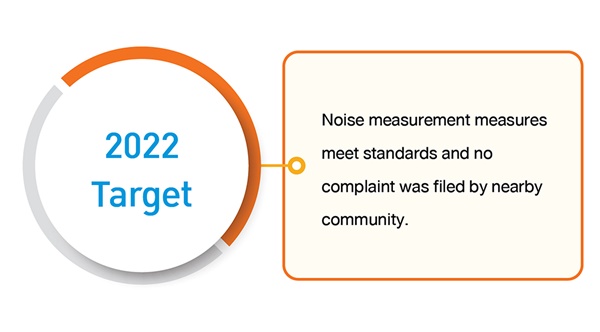
Noise management
RATCH’s power plants have established measures to watch out and keep noise from the production process within specified levels. Major noise contributors are generators, water pumps and maintenance activities. The power plants have ably complied with legal requirements on noise control, to protect job operators and community in the vicinity from negative impacts.
| Noise control and prevention | |
|
|
| Noise level measurement | |
|
|
Results of noise level monitoring in 2022
All six RATCH-controlled power plants in Thailand (contributing 83.81% of total revenue in 2022) have been able to keep noise level below permissible limits. Importantly, all did not receive complaints from nearby community concerning noise pollution.